Research in Economics

Using the User Cost of Monetary Assets to Explain the Investment Portion of Gross Domestic Product


By Adam Bourgoin-Stone


Over the summer, I have been co-writing a paper with Dr. Biyan Tang on the merits of utilizing the user cost of monetary assets rather than the interest rate in economic research, specifically research into the investment part of Gross Domestic Product. The paper itself is not complete yet, and the current results may change if errors in the regression are detected.  The paper has been submitted to present in a conference hosted by the Midwest Economics Association. This project has been and continues to be an incredible opportunity for me to not only learn more about economics, but also expand my critical reading and research skills.

Gross Domestic Product is often used in economics as an indicator of general economic growth. GDP is equal to Consumption + Investment + Government Spending + Net Exports. According to the Bureau of Economic Analysis, investment has remained at between 16% and 26% since 1947. Since investment is a significant portion of GDP, it is important to understand which factors correlate with it, and which factors can promote its growth. Based on traditional economic theory, the interest rate is negatively related to the level of investment that firms are willing to make. In other words, with a higher interest rate, investment will fall assuming other economic or political conditions remain the same. However, the relationship between the interest rate and investment can be unclear. Some research in the past has found a negative relationship; some has found a positive relationship; one paper found that the correlation changes significantly based on the interest rate level at the time of adjustment. A more intuitive tool for measuring investment as a part of GDP may be the user cost of monetary assets. The user cost is measured by the opportunity cost, or the forgone interest, of holding certain liquid monetary assets (like currency or checking account balance) versus holding pure investment assets. For example, if you held $1000 in cash, the user cost of your monetary asset would be the federal interest rate that you could have earned on the money had you kept it entirely in the form of investment assets such as treasury bonds. The user cost of monetary assets can be separated into the user costs for the various monetary aggregates, such as M1, M2, M3, and M4. A general overview of the monetary aggregates is that M1 contains the most liquid assets, and that each subsequent monetary aggregate contains the previous aggregate plus less liquid assets. For example, M1 contains physical currency, demand deposits, traveler’s checks, and other checkable deposits. M2 contains everything in M1, and also savings deposits, money market securities, mutual funds, and other time deposits.

Barnett (1978) derives a user cost formula for monetary assets:

where pit is the current period user cost of the per capita real balances of monetary asset i during period t, p*t is an aggregate index of the prices of good/services and of the prices of durable goods rental during period t, Rt is the yield on per capital bond holdings during period t, and rit is the nominal yield on monetary asset i during period t. The formula demonstrates that as the benchmark interest rate rises, the forgone interest rate increases with it.

The relationships of different economic factors with investment can be described using the Ordinary Least Squares regression

PriInv = b0 + b1(IntRate) + b2(rGDP) + b3(PubInv) +b4(PriCredit) + b5(CorpTax) + b6(Income) + b7(Inflat) + b8(TreasBond) + b9(Savings)

where the dependent variable is private investment in billions of dollars, and the independent variables are the interest rate, real GDP, public investment, credit available to the private sector, the effective corporate tax rate, aggregate income, the inflation rate, the treasury bond yield rate, and the savings rate. The user cost data was organized by the user costs for the different monetary aggregates (e.g. M1, M2, M3, M4). Two regressions were used, one using the interest rate, and the other replacing the interest rate with the user cost of monetary assets for M1. The adjusted R2, which is the percent of the variance of the dependent variable that is explained by the independent variables, was compared to determine whether the user cost is a better determinant of private investment than the interest rate. Regressions were run with the user cost for each monetary aggregate, with the regression that yielded the highest adjusted R2, the user cost for M1, being compared with the interest rate regression. The t-values of the interest rate and the user cost for each monetary aggregate were used to determine the statistical significance of each variable’s correlation with gross private investment. The statistical significance of each monetary aggregate’s user cost and the interest rate is visualized in Figure 1. Clearly, the interest rate is shown to have the most statistically significant correlation with the investment, and the user cost for M1 is shown to have the most significant relationship out of all of the user costs, though it is still statistically insignificant. Figures 2 and 3 show the interest rate and the user cost of M1 over time with gross private investment, respectively. The user cost and the interest rate are shown to be almost identical in proportion.

Figure 1, t-values of the interest rate and the monetary aggregate user costs


Figure 2, gross private investment and the interest rate over time


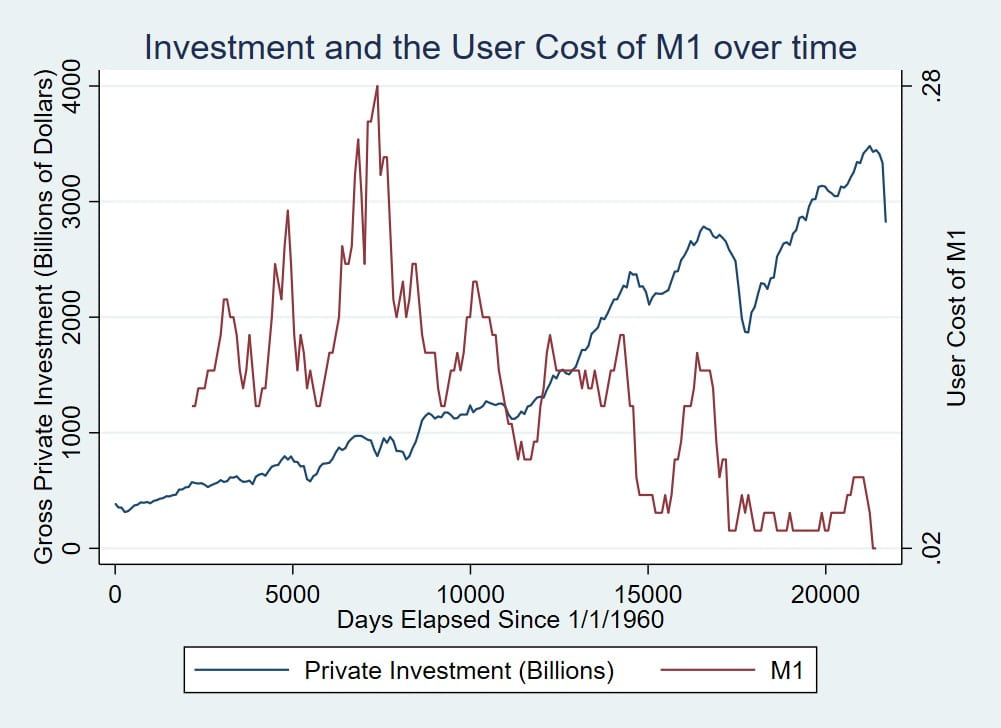
Figure 3, gross private investment and the user cost of M1 over time


The coefficients of each of the variables of the regression using the interest rate are shown in Figure 4. In this regression the interest rate is found to have a positive correlation with private investment. While at first glance, this seems contrary to traditional economic theory, this is likely because we did not add a lag to the regression. The relationship is shown to be positive because when investments fall, the federal reserve lowers the interest rate to stimulate investment, and when investment rises again, the federal reserve slowly returns interest rates to their previous values. The effective corporate tax rate was also shown to have a positive correlation, when a higher tax rate would be expected to lower the funds firms have at their disposal to invest, thereby reducing private investment. Figure 5 shows the regression using the M1 user cost (as that is the user cost that had the most significant correlation with investment, and the regression using the M1 user cost yielded the highest adjusted R2). The effective corporate tax rate is shown to have a positive relationship in this regression as well. In fact, most of the variables have similar values to the regression using the interest rate, except for the treasury bond yield rate and the inflation rate.

Figure 4, regression results for the interest rate. Standard errors are below coefficient values. *** – significant at 1% level. ** – 5% level. * – 10% level


Figure 5, regression results for the user cost. Standard errors are below coefficient values. *** – significant at 1% level. ** – 5% level. * – 10% level


The adjusted R2 of the regression using the interest rate was .9905, and the adjusted R2 of the regression with the user cost was .9881. This result is not unexpected, given the fact that the user cost was found to be statistically insignificant, while the interest rate was found to be significant at the 0.1% significance level, meaning that there is only a 0.1% risk of concluding that it is significant when it isn’t.

According to these results, the interest rate is probably a better variable than the user cost for explaining the variance of investment in the US. Secondary results include the statistical insignificance of the inflation rate when explaining investment, and also the inconsistency of the treasury bond yield rate’s significance. When using the interest rate, it was found to be mostly insignificant, but when using the user cost for M1, it was found to be significant at or above the 1% level. Based on these current results, I cannot conclude that the user cost of monetary assets is a more efficient factor than the interest rate for analysis of the investment part of GDP.

I want to thank the Dean of the UMass Dartmouth College of Arts and Sciences, Dr. Pauline Entin, for the generous stipend that I was granted for my summer project.

Works Cited in Paper

Acha, Anthony, and Kelechi Acha. “Interest Rates in Nigeria: an Analytical Perspective.” Research Journal of Finance and Accounting, vol. 2, no. 3, 14 Apr. 2016, pp. 71–81.

Agu, Osmond Chigozie. “DETERMINANTS OF PRIVATE INVESTMENT IN NIGERIA: AN ECONOMETRIC ANALYSIS.” International Journal of Economics, Commerce and Management, vol. 3, no. 4, Apr. 2015.

Ahmed, Afaq, and Muhammad Mubarik. “Impact of Interest Rate and Inflation on Stock Market Index: A Case of Pakistan .” Jan. 2012.

Ajide, Kazeem, and Olukemi Lawanson. “Modelling the Long Run Determinants of Domestic Private Investment in Nigeria.” Asian Social Science, vol. 8, no. 13, 2012.

Akhtar, M. A. “Effects of Interest Rates and Inflation on Aggregate Inventory Investment in the United States.” The American Economic Review, vol. 73, no. 3, June 1983, pp. 319–328.

Albu, Lucian Liviu. “TRENDS IN THE INTEREST RATE–INVESTMENT– GDP GROWTH RELATIONSHIP .” Romanian Journal of Economic Forecasting, vol. 3, Jan. 2006, pp. 5–13.

Appienti, William, et al. “KEY DETERMINANTS OF INVESTMENTIN GHANA: COINTEGRATION AND CAUSALITY ANALYSIS.” May 2016.

Awan, Rehmat, et al. “Rate of Interest, Financial Liberalization & Domestic Savings Behavior in Pakistan.” International Journal of Economics and Finance, vol. 2, no. 4, 2010.

Bagci, Erdem, and Emre Erguven. “Relations between Interest Rate, Inflation, Growth AndInvestment in Turkey, 2002-2015 .” 2016.

Bitros, Georgios, and M. Ishaq Nadiri. “Elasticities of Business Investment in the U.S. and Their Policy Implications : A Disaggregate Approach to Modeling and Estimation .” July 2017.

Chen, K. C., and Daniel Tzang. “Interest-Rate Sensitivity of Real Estate Investment Trusts.” The Journal of Real Estate Research, vol. 3, no. 3, 1988, pp. 13–22.

Heim, John. “THE INVESTMENT FUNCTION: DETERMINANTS OF DEMAND FOR INVESTMENT GOODS.” Jan. 2008.

Kosma, Olga. “Determinants of Investment Activity: the Case of Greece.” 2015.

Maccini, Louis, et al. “The Interest Rate, Learning, and Inventory Investments.” American Economic Review, vol. 94, no. 5, Dec. 2004, pp. 1303–1327.

Magableh, Sohail, and Sameh Ajlouni. “Determinants of Private Investment in Jordan: An ARDL Bounds Testing Approach.” Dirasat, vol. 43, no. 1, Jan. 2016.

Mueller, Glenn, and Keith Pauley. “The Effect of Interest-Rate Movements on Real Estate Investment Trusts.” Journal of Real Estate Research, vol. 10, no. 3, Feb. 1995, pp. 319–326.

Munir, Rahila, et al. “Investment, Savings, Interest Rate and Bank Credit to the Private Sector Nexus in Pakistan.” International Journal of Marketing Studies, vol. 2, no. 1, 2010.

Noman, Muhammad. “Rate of Interest and Its Impact on Investment to the Extent of Pakistan .” Sept. 2018.

Obamuyi, Tomola, and Sola Olorunfemi. “Financial Reforms, Interest Rate Behaviour and Economic Growth in Nigeria.” Journal of Applied Finance & Banking, vol. 1, no. 4, 2011, pp. 39–55.

Olweny, Tobias. “The Effect of Monetary Policy on Private Sector Investment in Kenya.” Apr. 2012.

Opreana, Alin. “THE LONG-TERM DETERMINANTS OF INVESTMENT: A DYNAMIC APPROACH FOR THE FUTURE ECONOMIC POLICIES.” Studies in Business and Economics, vol. 5, no. 3, Jan. 2010, pp. 227–237.

Oriavwote, Victor, and Dickson Oyovwi. “Interest Rate and Investment Decision in Nigeria: A Cointegration Approach.” American Journal of Business and Management, Mar. 2014.

Osei-Assibey, Eric, and William Baah-Boateng. “Interest Rate Deregulation and Private Investment: Revisiting the McKinnon-Shaw Hypothesis in Ghana.” The IUP Journal of Applied Economics, vol. 11, no. 2, Apr. 2012, pp. 12–30.

Pelgrin, Florian, and Sebastian Schich. “PANEL COINTEGRATION ANALYSIS OF THE FINANCE-INVESTMENT LINK IN OECD COUNTRIES.” Document De Travail De L’OFCE, Jan. 2002.

Peng, Liang, and Thomas Thibodeau. “Interest Rates and Investment: Evidence from Commercial Real Estate.” Journal of Real Estate Finance and Economics, vol. 60, no. 4, 1 May 2020.

Peter, Audu, and Oluwoyo Temidayo. “Testing the Validity of McKinnon-Shaw Hypothesis: Empirical Evidence from Nigeria.” Asian Journal of Economics, Business and Accounting, vol. 2, no. 2, 2017, pp. 1–24.

Sharpe, Steve, and Gustavo Suarez. “Why Isn’t Investment More Sensitive to Interest Rates: Evidence from Surveys.” 1 Oct. 2015.

Tan, Willie. “GNP, Interest Rate and Construction Investment (Tan 1987).” Construction Management and Economics, vol. 6, no. 3, 28 July 1988, pp. 185–193.

Udah, Enang. “MACROECONOMIC REFORMS, GOVERNMENT SIZE, AND INVESTMENT BEHAVIOR IN NIGERIA: AN EMPIRICAL INVESTIGATION.” European Journal of Social Sciences, vol. 33, no. 2, Aug. 2012.

Waheed, Abdul. “Determinants of Domestic Private Investment: Test of Alternative Hypotheses for Pakistan.” International Journal of Research in Business and Social Science, 2015.

Research in Psychology

Behavioral Expression of Anger in Preschoolers


by Sophia Baxendale

Over the summer and into the fall, I worked with Dr. Locke-Arkerson to learn to code facial, bodily, and vocal expressions of context-appropriate and inappropriate anger in preschoolers. I was awarded a summer research award for 2020 by the Office of Undergraduate Research, funded by the College of Arts and Sciences. The opportunity to work one-on-one with Dr. Locke-Arkerson has provided me with an excellent opportunity to learn more about behavioral data and research with children. Learning how to code and working with Dr. Arkerson has fostered confidence in my ability to learn different aspects of research, and I look forward to continuing to code this sample to learn more about emotional expression in different contexts.

Background

Anger regulation involves the modification of emotional responses to situational changes (Thompson, 1994). Until now, research on anger expression has been limited to identifying children who show more anger than others in appropriate contexts (e.g., delay of gratification, blocked goals; Brooker et al., 2014; Cole et al., 2011; Gilliom et al., 2002). However, Dr. Locke-Arkerson has also measured anger during threatening and positive situations (context-inappropriate “CI anger”) (Locke et al., 2009; Locke et al., 2015). CI anger has been found to increase the risk of externalizing behavior and peer rejection (Locke & Lang, 2016; Locke et al., 2017; Locke et al., 2015). CI anger uniquely predicts these outcomes above and beyond CA anger. It also differs from the way anger has historically been studied, as its correlation with CA anger is only moderate. Dr. Locke-Arkerson’s research utilizes a novel approach to understanding emotional responses by studying them in distinct contexts to determine which children are unable to regulate anger responses in adaptive and acceptable ways.

The collection of behavioral data in research conducted with children has use beyond what is possible to collect from questionnaires. In order to translate collected behavioral data into ratings, a standardized and objective system of observation must be in place. The individuals rating of behaviors (“coding”) must reach a level of agreement, or interrater reliability. Once reliable, the individual coders can rate behaviors independently and these ratings can be used quantitatively for statistical analysis.

The aim of this project was to learn and become reliable in coding facial, bodily, and vocal expressions of context-appropriate and inappropriate anger in preschoolers. This project met the goal of obtaining acceptable interrater reliability for assessing the level of facial, bodily, and vocal expressions of anger during emotion-eliciting episodes in preschool-age children. CI anger in prior studies focused on facial expressions of anger in response to affective pictures, slides, and videos (Locke et al., 2015), making the data coded in this project unique.

Method

Participants

Participants included 69 four-to-five-year-old children from preschools local to UMass Dartmouth.

Procedures

Data used for this project was collected for a larger study exploring emotional and biological measures associated with behavior problems in children. For this project, I was trained on how to code expressions of anger during an anger-eliciting episode. Training on the coding of behavioral data required regular remote meetings and practice sessions with the master coder, Dr. Locke-Arkerson. Prior to training, Dr. Locke-Arkerson developed our training manual for the anger episode. I also filled out the coding sheets with the begin and end times of the episode for each individual subject. Dr. Locke-Arkerson reviewed the episode-specific manual and the System for Identifying Affect Expressions by Holistic Judgments coding system (AFFEX; Izard, Dougherty, & Hembree, 1989) manual with a graduate student, Samantha Clark, and myself. We were then assigned practice cases to code independently, and to discuss together. Samantha and I met several times to compare our codes, and then brought our discrepancies to Dr. Locke-

Arkerson. We reviewed the discrepancies as a group and worked together to determine our sensitivity level to minute expressions of anger. This training process took approximately 127 hours, which was followed by reliability coding, in which I was assigned cases to code independently for all four variables. My codes were compared to the Master Codes created by Dr. Locke-Arkerson and were reviewed to understand where we disagreed. Through the training and reliability process, Dr. Locke-Arkerson and I were able to completely code 24 participants and partially code 17 more for the anger-eliciting episode.

Measures

Context-Appropriate and Inappropriate Anger. Children were videotaped during episodes of the Laboratory Assessment Battery (LabTAB; Goldsmith et al., 1999), which were used to assess appropriate and inappropriate anger in distinct contexts (positive, threatening, frustrating).

Anger episode. The anger episode that was used for reliability training was the I’m Not Sharing game. During the I’m Not Sharing game, the experimenter shares candy with the child and will give themselves more candy than the child. In the end, the experimenter gives the child two pieces of candy.

Behavioral scoring. Coders rated anger facial, bodily, and vocal expressions during the episode using the LabTAB and Affex coding systems.

Pictured: A child playing I’m Not Sharing game.

Results

Dr. Locke-Arkerson assigned me reliability coding for the different variables after an intensive training period. Agreement between my codes and the master codes were determined through a calculation of hits and misses for each variable: presence for vocalizations and bodily resistance, intensity for bodily and facial expressions of anger. The minimum Cohen’s Kappa score to be reliable was .7, or approximately 90% agreement with the Master codes. I was assigned 10 cases for each variable until I was reliable according to the calculated Cohen’s Kappa. I required 10 cases to reach a Cohen’s Kappa of .7 for bodily resistance, or instances where the child attempted to stop the episode. I required 21 cases to reach a Cohen’s Kappa of .7 for vocalizations of anger. I required 20 cases to reach a Cohen’s Kappa of .74 for bodily expressions of anger. I required 20 cases to reach a Cohen’s Kappa of .73 for facial expressions of anger. This means that I will be able to code reliably for the rest of the episode and other episodes moving forward to produce qualitative data that can be used quantitatively for data analysis to address study hypotheses. The coding completed through training and reliability amounted to around 60% of the total data set being at least partially coded for the I’m Not Sharing episode.

Discussion

Over the course of this project, I accomplished my goal of becoming a reliable coder and leading to the near completion of coding all participants for the I’m Not Sharing anger-eliciting episode. With Dr. Locke-Arkerson’s commitment to this project and my training, I was able to learn how to code and become reliable. Given that we were unable to meet in person, my training required modifications to be the most effective for a remote modality. This meant meeting with Dr. Locke-Arkerson several times a week for up to three hours at a time to make sure that we were identifying the same behaviors as anger. The process of learning such a skill was exciting, as it enhanced my working relationship with Dr. Locke-Arkerson and allowed me to see a side of research that I had misunderstood in an academic setting previously. I did not understand the value of behavioral data, as I believed it to be too subjective. After going through such an intense and rigorous training process, I now have a better understanding of how behavioral data can be quantified. It was also exciting to be able to identify slight tells of anger in children, something I was not able to pick up explicitly when I helped administer the episodes prior to the pandemic. While I may have been able to sense frustration, I was not able to identify specific incidences of anger prior to watching the episode as a trained coder with an understanding of slight expressions of anger, especially in the body and face.

I anticipate being able to complete coding of our sample for I’m Not Sharing soon, to be followed by positive and non-social fear episodes. The positive episodes that may be coded include the Surprise! and Popping Bubbles episodes. The non-social fear episode that will be coded is the Scary Mask episode. I am excited to see how our sample expresses anger in contexts that would not be considered appropriate, allowing for more questions to be asked. The completion of coding will allow Dr. Locke-Arkerson and her lab to use the data to enhance the literature on child behavioral and emotional expression, as well as assisting findings in Dr. Locke-Arkerson’s ongoing study. This data will become a resource for myself and future research assistants to use for poster presentations and manuscripts. Specific analyses that this data set can be used for include assessment of the association between behavioral measures and a parent-report measure of CI anger (Locke & Lang, 2016). This data set may also be used to supplement an ongoing manuscript that Dr. Locke-Arkerson, Samantha Clark, and I are working on regarding children who withdraw.

Learning how to code and becoming reliable is a skill has been invaluable to my understanding of hands-on data processing and I am incredibly grateful for the opportunity to build on my research experience. It has been rewarding to gain perspective from both data collection and coding that I have had the opportunity to be a part of in Dr. Locke-Arkerson’s Child Emotion Lab. Thank you to the Office of Undergraduate Research and the College of Arts and Sciences, especially Dean Entin for expressing interest in this project and awarding me the funds to pursue it. The time invested in this project has and will continue to propel progress in our lab and the research program. Thank you to Dr. Locke-Arkerson for committing to this project and taking the time to strengthen my confidence in attention to detail.

References

Arsenio, W., Cooperman, S., & Lover, Anthony. (2000). Affective predictors of preschoolers’ aggression and peer acceptance: Direct and indirect effects. Developmental Psychology. 36. 438-48. doi: 10.1037//0012-1649.36.4.438.

Brooker, R. J., Buss, K. A., Lemery-Chalfant, K., Aksan, N., Davidson, R. J., & Goldsmith, H. H. (2014). Profiles of observed infant anger predict preschool behavior problems: Moderation by life stress. Developmental Psychology, 50(10), 2343-2352.

Cole, P. M., Tan, P. Z., Hall, S. E., Zhang, Y., Crnic, K. A., Blair, C. B., & Li, R. (2011). Developmental changes in anger expression and attention focus: Learning to wait. Developmental Psychology, 47(4), 1078–1089. doi: 10.1037/a0023813.

Cole, P.M., Martin, S.E. and Dennis, T.A. (2004), Emotion regulation as a scientific construct: Methodological challenges and directions for child development research. Child Development, 75: 317-333. doi:10.1111/j.1467-8624.2004.00673.x.

Cole, P. M., Michel, M. K., & Teti, L. O. (1994). The development of emotion regulation and dysregulation: A clinical perspective. Monographs of the Society for Research in Child Development, 59(2-3), 73–100, 250–283. doi: 10.2307/1166139.

Gilliom, M., Shaw, D. S., Beck, J. E., Schonberg, M. A., & Lukon, J. L. (2002). Anger regulation in disadvantaged preschool boys: Strategies, antecedents, and the development of self-control. Developmental Psychology, 38(2), 222–235. doi: 10.1037/0012-1649.38.2.222.

Goldsmith, H. H., Reilly, J., Lemery, K. S., Longley, S., & Prescott, A. (1999). The Laboratory Temperament Assessment Battery (Lab-TAB): Preschool Version 1.0. Technical manual. Madison: University of Wisconsin, Department of Psychology.

Izard, C. E., Dougherty, L. M., & Hembree, E. A. (1989). A system for identifying affect expressions by holistic judgments (Affex) (rev. ed.). Newark: University of Delaware, University Media Services.

Locke, R. L., Davidson, R. J., Kalin, N. H., & Goldsmith, H. H. (2009). Children’s context inappropriate anger and salivary cortisol, Developmental Psychology, 45(5), 1284-1297. doi: 10.1037/a0015975.

Locke, R. L., & Lang, N. J. (2016). Emotion knowledge and attentional differences in preschoolers showing context-inappropriate anger. Perceptual and Motor Skills, 123(1), 46-63. doi: 10.1177/0031512516658473.

Locke, R. L., Lemery-Chalfant, K., Brooker, R., Davidson, R. J., & Goldsmith, H. H. (2017, April). Physiological and behavioral outcomes associated with anger dysregulation. Paper presented at the Biennial Meeting of the Society for Research in Child Development, Austin, TX.

Locke, R. L., Miller, A. L., Seifer, R., & Heinze, J. E. (2015). Context-inappropriate anger, emotion knowledge deficits, and negative social experiences in preschool. Developmental Psychology, 51(10), 1450-1463. doi: 10.1037/a0039528.

Thompson, R.A. (1994). Emotion regulation: A theme in search of definition. Monographs of Society for Research of Child Development. 59. 25-52. doi: 10.1111/j.1540- 5834.1994.tb01276.x.