Research In Biology
Risk-Induced Behavioral Changes Increase Survival When Exposed to Predators
By Isabella Mancini
 Portrait of Isabella Mancini, her colleagues, and mentor,
Prof. Michael Sheriff, at Benthic Ecology Society’s annual meeting
in Portsmouth New Hampshire
Abstract
Predation risk is a pervasive force in ecology, shaping species interactions and community dynamics. When prey are exposed to predators they may alter their behavior, physiology, or morphology. Risk-induced behavioral changes can include changes to prey refuge use and risk aversion behavior. I hypothesized that the strength of these non-consumptive effects and prey behavioral decisions may depend on resource availability or prey state. I tested this by either exposing the dogwhelk, Nucella lapillus, to non-lethal green crabs, Carcinus maenas (rendered non-lethal by gluing their claws together) or not, for 28 days while varying food availability using the basal resource, Mytilus edulis. We measured individual behavior of Nucella every 3 days throughout the experiment. We also measured initial and final tissue weights, shell weights, and shell lengths of each Nucella in order to track growth. We found that risk-exposed Nucella were more risk averse. We also found that food availability increased risk aversion regardless of risk treatment. Food availability also significantly increased individual growth compared to non-food treatments. I found that there was a cost of predation risk on individual growth when compared to non-risk treatments, however initial prey state did not significantly impact risk aversion, nor did growth. These findings support the hypothesis that resources increase prey state enough to decrease risky behavior when faced with predation risk.
Introduction
The influence of predation risk on prey species and communities has become an emerging topic of study in the field of ecology. The risk of predation alone (not including consumption or killing) can alter prey phenotype, fitness, and influence species interactions within entire trophic chains (Peacor et al. 2020). These risk-induced responses may also be impacted by the environment in which they occur and may vary based on individual prey state or condition (Matassa et al. 2016). Learning the nuances of these prey responses is important to understanding the trophic relations and population dynamics in these systems.
Using a notable set of predator-prey interactions in the New England intertidal ecosystem, green crabs (Carcinus maenas) and dog whelk snails (Nucella lapillus), we investigate a novel area of this research: how prey decide to allocate their energy to either foraging or antipredator behaviors. Literature on how resource availability may impact refuge use behavior is lacking in its investigation into the decision a prey would make if the resources are outside of the refuge.
A 2016 study on Nucella, using barnacles as a resource, concluded that food outside of the refuge was enticing prey to engage in more risky behavior in the presence of risk and found that prey state did not dramatically affect this result (Matassa et al. 2016). The impact that food quality and handling time could have on this result is still in question. The alternative hypothesis that available resources could increase prey state, allowing them to stay in the refuge more often, has also not been thoroughly explored. Here we expand upon the Matassa et al. (2016) study to examine individual level risk aversion behavior and growth when prey are exposed to predation risk or not across two different resource levels during a 4-week mesocosm experiment. We considered both resource availability hypotheses and made predictions that would support each.
Methods
Experimental design
We tested the influence of resource availability on prey refuge use behavior using a mesocosm laboratory experiment at the UMass Dartmouth School for Marine Science and Technology campus in New Bedford, MA. 15 Nucella, 10 of which were tagged and used for this experiment, (15.6 ± 1.3 mm, mean shell length ± SD) were placed in each of 24 clear-plastic mesocosms (44.45 cm. L x 30.48 cm W x 17.78 cm H) with independent flowthrough sea water (Buzzards Bay, ~ 18℃) and a 20.32cm2 tile refuge elevated 2cm from the mesocosm floor by PCV pipe. The refuge could be accessed by Nucella but was too low for Carcinus to fit under. Snails could also access the top of the wall and underside lid of the mesocosm for refuge, as crabs could not attack them there (tested, but data not shown). 12 of the mesocosms had a single non-lethal green crab (52.2 ± 0.8 mm, mean carapace width ± SD with its claws banded and super glued shut to ensure they could not consume snails) and 12 mesocosms had blue mussels added as a resource (ad libitum) for a fully crossed 2×2 experiment, including: 6 food plus predation risk (FPR), 6 food no risk (FNR), 6 no-food plus predation risk (NFPR), and 6 no food no risk (NFNR) treatments. The experiment was conducted for 28 days from 7/19/21 to 8/18/21
We recorded snail location every 3 days for all tagged snails. Our designation of in a refuge or in the open was based upon those from Matassa et al. 2016, however, we also conducted preliminary feeding trials with crabs to determine where they could access and consume prey by attaching food (fish) to various locations on the wall and underside of the mesocosm lid. Snail location observations were scored as a -1 if snails were on the tile, in the open or low on the wall where they could be eaten, a 0 if snails were mid-way on the wall where crabs had difficulty accessing them, or a 1 if snails were under the tile, at the very top of the wall or the underside of the lid where crabs could not access them. The sum of the scores was used to estimate individual risk aversion scores for each tagged snail over the 28 days of the experiment. Shell and tissue weights of each tagged snail were taken using a non-destructive buoyant weighing technique (Palmer, 1982) and shell length was recorded using digital calipers. The weights and shell lengths were taken at the beginning and end of the experiment, and growth was calculated as the final-initial measurements.
Results
Pairwise comparisons were made between treatment groups and risk aversion score averages (Fig1). There was a significant difference between the FR and non-food treatments (FR|NFC p<0.001, FR|NFR p<0.01, Fig1). There was also a significant difference between our food with risk and food with no-risk groups (FR|FC p<0.001, Fig1). Risk and food both independently and combined increased risk aversion score. Pairwise comparisons were also made between each treatment and each of our growth metrics across the experiment, tissue weight, shell weight, and shell length (Fig2). Food availability significantly increased all growth metrics when comparing each food treatment to it’s corresponding no-food treatment (FC|NFC and FC|NFR p< 0.001, FR|NFC and FR|NFR p=0.003 Fig 2). Predation risk caused a significant cost in growth when comparing the food control and food risk treatments (FR|FR; tissue and shell weight growth p<0.001, shell length growth p=0.002, Fig2). Risk aversion averages were then compared to the initial state of individual based on each growth metric (Fig3). Risk aversion averages were also compared to overall growth across the experiment using each metric (Fig3). Although there appears to be a negative correlation between risk aversion and each metric in both cases, almost all of these trends were not statistically significant (p>0.05, Fig3) and no correlation was found between risk aversion and initial or overall growth (R2 ~0.33).
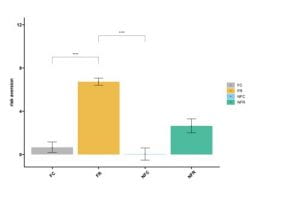
Fig 1. Risk Aversion vs Treatment. This graph shows comparisons of each of the four treatment groups to the average risk aversion score of individual snails within that treatment. Asterisks indicate significance (**** p<0.001). Bars show Mean +/- SD.
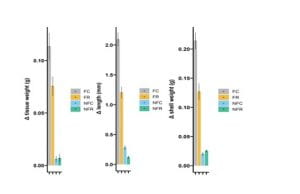
Fig 2. Growth Metrics vs Treatment. These graphs show comparisons of each of the four treatments groups to the average growth for each growth metric (tissue weight, shell length, shell weight). Bars show Mean +/- SD.

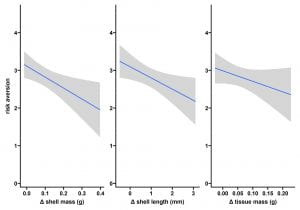
Fig 3. Risk Aversion vs Initial State & Growth. These graphs show trends in risk aversion behavior in comparison to trends in individual initial body condition and in each growth metric. None of these comparisons were statistically significant. Lines show Mean +/- SE.
Discussion
We found that food availability increases growth across all metrics. This means prey that have higher resources are able to grow more. This result occurred as expected, however by comparing the food treatment groups to each other, we are also able to show that predation risk causes a cost to growth. That is, the prey in the FR treatment grew less than the prey in the FNR treatment. This finding could easily be attributed to the negative impacts that predation risk is assumed to have on a prey’s ability to forage, however our remaining findings show that this assumption is not as simple as it seems.
A prey’s ability to prioritize and allocate energy between both foraging and antipredator behaviors has major implications for it’s ability to grow and increase it’s fitness. We found that both food and risk being present increase refuge use both independently and together. These results support the hypothesis that food availability increases prey state enough that they do not need to leave the refuge to forage as often. This is contradictory to the hypothesis (supported by the Matassa et al. 2016) that food availability would increase foraging and entice prey out of the refuge therefore decreasing risk aversion. If this was the case in our study, the lowest risk aversion score should’ve been seen in the FC treatment, but that was not the case. Instead we found that the lowest risk aversion behavior and least refuge use occurred in the NFC group. There are many possible explanations for why our results support this alternative hypothesis in compared to the previous research. More investigation needs to be done into how the quantity and quality of resources available to prey impact their behavioral decisions. Studies considering the natural and baseline levels of refuge use or fear of predation within prey could also help give insight into these types of contradicting behaviors seen across studies and taxa.
§
My Experience at the Benthic Ecology Meeting

Isabella Mancini at the Benthic Ecology Society’s annual meeting in
Portsmouth, New Hampshire
I was lucky enough to attend the Benthic Ecology Meeting in Portsmouth, New Hampshire as part of the Sheriff lab this semester and it was a very unique experience. As an undergraduate, being able to attend a conference like this was incredibly valuable. I got to see tons of presentations of other scientists’ work in the field of ecology and network with professionals. Along with presenting my own work as a poster, I was able to discuss my work with others, including the very people I had cited in my paper, which was amazing. This experience helped me to learn how the world of academia really works and allowed me to talk with people at all stages of their careers, which was extremely beneficial to my understanding of the steps it takes to build a career in the field of biology.


 Work produced by James Ristaino for the NEH-funded, collaborative, and